America’s picturesque small beach towns often look like they belong on a postcard. Yet, just because a place seems carefree, it doesn’t mean the people feel very merry. So we at Beach.com were curious: where in the U.S. are the happiest small beach towns?
In pursuit of this question, we analyzed 100,000 Instagram photos from 100 small beach towns (with a population of less than 250,000 and located within 25 miles of a coast). Using an AI-powered emotion recognition model, DeepFace, we identified where coastal smiles shine as brightly as the sun. The destinations we uncovered are more than beautiful; they radiate joy, like these charming U.S. beach towns where delight and carefree go hand in hand.
Table of Contents
Key Findings
- Charleston, South Carolina, is the happiest small beach town in the U.S.
- Huntington Beach, California, is the most emotionally expressive beach town.
- Inglewood, California, has the widest variety of emotions in Instagram photos.
Where Happiness Hits the Shore
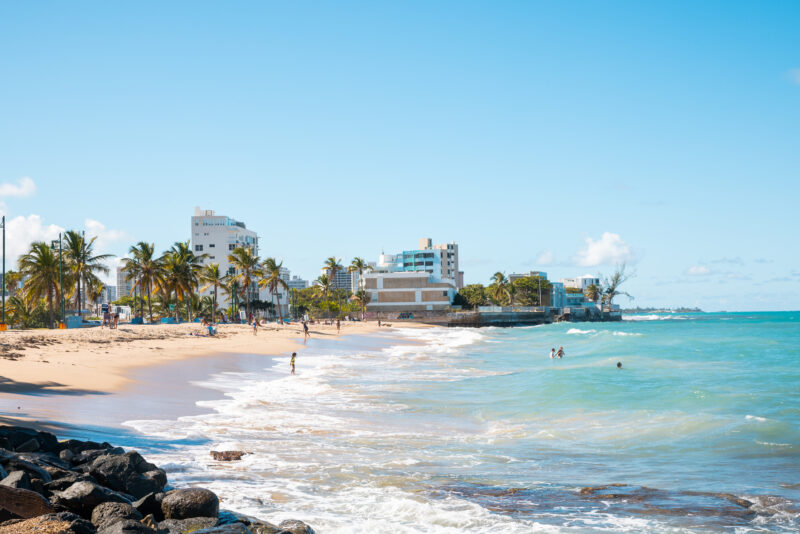
Happiness appears most contagious along the South Carolina coast. Charleston, South Carolina, tops the list as the happiest small beach town in America. Out of 1,060 faces analyzed in Instagram photos, 606 had dominant expressions of happiness. When factoring in the AI confidence levels, Charleston has a total happiness score of 572.
Total happiness is the sum of the confidence scores of all faces detected as happy. The maximum possible value is equal to the total number of faces analyzed, which in Charleston’s case is 1,060 faces. Charleston’s happiness score then translates to a 54 out of 100 in our happiness index — the highest in the study.
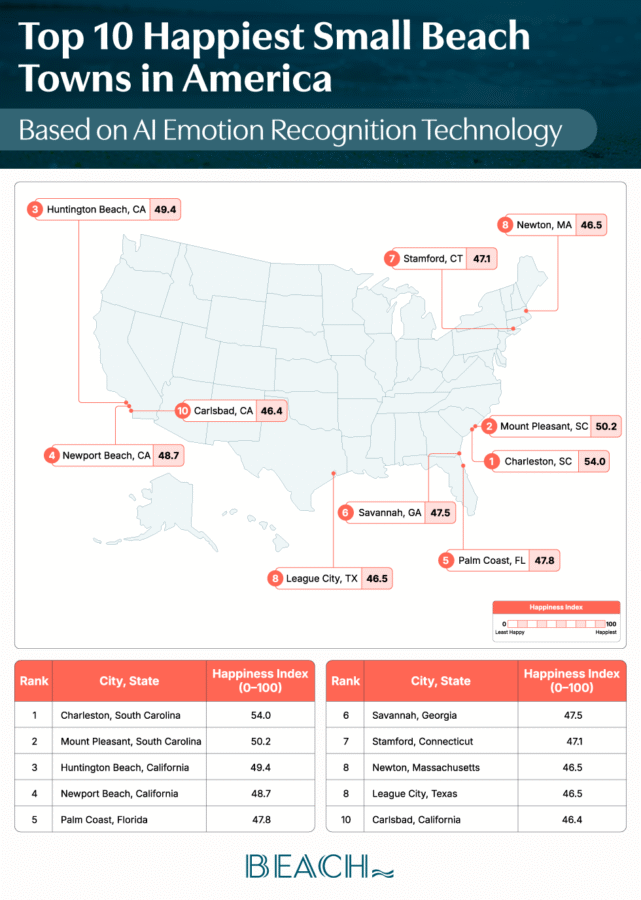
As further evidence that this part of the country largely posts Instagram photos brimming with smiles, Mount Pleasant, South Carolina, just across the harbor, secures the #2 spot. Out of 612 total faces analyzed, Mount Pleasant earns a happiness index score of 50.2.
Our #3 happiest town is on the opposite coast. Huntington Beach, California, (AKA Surf City) shows that joy doesn’t just belong to the East Coast. Out of 1,176 faces analyzed, 619 had dominant expressions of happiness. When factoring in the AI confidence levels, Huntington Beach has a total happiness score of 581. That translates to a score of 49.4 out of 100 in our happiness index.
When we aggregate total happiness at the state level, Georgia emerges as the state with the highest average happiness index. At 47.5 out of 100, Georgia barely edges out above South Carolina’s 46.5 for the top spot state-wise. North Carolina is a close #3 with an index score of 46.3.
The Full Emotional Tide
There’s more than one way to unpack emotion recognition analyses. The confidence level that AI emotion tech assigns to the expressions it reads is indicative of expressiveness. The more expressive an individual is in their emotions, the more likely AI will detect those emotions. Better detection results in a higher emotional confidence score.
In this measurement, Huntington Beach, California, pans out as the #1 most emotionally expressive town, regardless of the emotion. This rank is driven by having the highest average emotional confidence scores. Since Huntington Beach ranks #3 for the happiest town, most of the highly expressive emotions detected here are happy ones.
By isolating the emotional confidence scores of individuals labeled as happy, we can also identify the towns where expressions of happiness are most intense. Driven by the highest average emotional confidence scores of detected happy faces, Huntington Beach, California, yet again, lands #1 for the most expressive or intense smiles.
However, not every seaside smile shines as brightly as a midday beach sun. Using the same method we used to identify the happiest beach towns, we found the city where neutral expressions are most prevalent. Interestingly, North Charleston, South Carolina, emerges as the #1 most poker-faced small town in America. Nearly a third of detected faces were labeled as neutral expressions.
Charleston, South Carolina, is the happiest small beach town, and North Charleston, the most poker-faced. These two towns are playing out a bit of a West Side Story of feuding emotional narratives.
Emotional dominance or expressiveness are just two ways to unpack AI emotion recognition tech. Another is emotional range, or diversity. Using the Shannon Diversity Index formula, we found the small beach towns holding the widest emotional spectrum in their Instagram photos. From happy to sad, surprised to angry, and everything in between, Inglewood, California, is the town with the widest variety of emotions in its Instagram photos.
Next door, South Gate, California, pans out as the #2 town with the highest emotional range. Just southeast of Inglewood, California, is Compton, California, which is the #3 town with the highest emotional range. These top three towns form a triangle of emotional dynamism, which is as wide and varied in emotion as these towns are in culture.
On the opposite end of the emotional range, Charleston, South Carolina, has the least variety of emotions in our analysis. It’s not that Charlestonians don’t possess an emotional range, but rather they’re all too busy focusing on happiness. After all, the city lands the top spot for the happiest small beach town in America. A city will have less emotional range if it’s mostly dominated by one emotion, as is the case with Charleston.
Your Gangway to Happiness
The happiest beach towns in America are not merely picturesque destinations, but vibrant communities full of happy people that can brighten any coastal escape. Our small, but happy community at Beach.com is passionate about chasing after the best laughter-filled postcard-perfect shorelines.
If you’re looking for the perfect pairing of genuine joy and irresistible character, start with any of these ideal stays. Or, check our guide to Florida’s most charming beach towns. Let the happy folks at Beach.com plan your perfect getaway. When happiness meets charm, your time by the water can create memories that last a lifetime.
Sources and Methodology
We analyzed 100 of the most populous small coastal towns in the U.S. (with a population under 250,000 and within 25 miles of an ocean coastline). We did this by collecting 1,000 of the most recent publicly posted, geo-tagged Instagram photos from each, totaling 100,000 images. Then we used DeepFace, a facial recognition and emotion analysis Python library model. Through DeepFace, we identified faces, classified their dominant emotion among seven categories, and recorded the AI’s confidence level. After removing photos without faces, 85,019 images remained, covering 99 towns with statistically significant sample sizes. We calculated a “Happiness Index” by averaging the confidence scores of happy expressions across all detected faces. We conducted additional analyses to identify towns with the most expressive faces, the most intense smiles, the most neutral expressions, and the widest emotional diversity, using the Shannon Diversity Index.
Since our analysis was based on the Census Bureau’s annual population estimates, and since Hawaii does not have incorporated cities, the annual Census estimates only include Urban Honolulu CDP. Urban Honolulu CDP has a population of over 250,000; therefore, Hawaii was excluded from the analysis.
Click to Expand the Full Methodology
The Towns: We began by compiling a list of 100 small coastal U.S. cities and towns, utilizing Census data and Google Earth. The towns included in this analysis have a population of less than 250,000 (as of 2020), and are located within 25 miles (haversine distance) of an ocean coastline. We selected the 100 most populous towns that fit this criterion.
Hawaii Note: The locations used for inclusion in the analysis are based on the Census Bureau’s annual population estimates tables. Due to Hawaii’s unique governmental structure, the Urban Honolulu CDP is the sole sub-county geographic area in the state that receives annual population estimates from the U.S. Census Bureau. Hawaii has no incorporated cities; therefore, all data are collected and reported as CDPs. The Census Bureau only lists the Urban Honolulu CDP in population estimates. Since our analysis was based on this census dataset and since the Urban Honolulu CDP has a population over 250,000, no Hawaiian cities were included in the analysis.
Extraction: Then, using the Instagram Location Pages for each town, we gathered the most recent 1,000 publicly posted, geo-tagged photos (as of August 7, 2025) from each of the 100 cities on our list. The total was 100,000 photos.
AI Emotion Recognition: Next, we ran each of the 100,000 images through DeepFace, a Python library for face recognition and facial attribute analysis. Its configurations can achieve better facial detection accuracy than humans. Using the default model, we ran the emotion model class task to identify people in each of these photos and determine their most likely emotion. The model can detect seven basic human emotions: anger, fear, neutral, sadness, disgust, happiness, and surprise. It assigns a confidence level to each detected emotion.
Limitations: Unable to implement facial recognition at image acquisition, we ended up with many photos that did not contain a single face. DeepFace assigns confidence levels to how certain the model is that it is detecting a face in an image. Using this confidence rate, we were able to remove all photos from the collection that did not contain any faces. After removing pictures without faces, 85,019 images with faces remained for analysis. Many photos had more than one face, of course, as well. Therefore, after analyzing facial recognition and emotion detection, we verified that each town had an appropriate number of total faces to achieve statistically significant results for each city at the 95% confidence level. This was, by far, more than true for every town included, except for Miramar, Florida. We removed this town from the final analysis. Ninety-nine towns remained.
Happiness Index: Then, we created a simple happiness index based on the dominant emotions detected, their confidence levels, and the number of faces analyzed. Happiness Index = 100 × ( Σ(HappyProbᵢ) ÷ N ) where N = total number of faces detected in that city. This score represents the total confidence of all “happy” faces detected in a city’s photos, divided by the total number of faces (happy or not). Then multiplied by 100.
The index measures both how often people appeared happy in the photos and how certain the AI was about those smiles. The resulting scores range from 0 to 100. A score of 100 represents a city where every person in every analyzed photo was identified as happy with 100% confidence by the AI. The reason the highest-scoring location has a score of 54 is that a city where every person in every photo geo-tagged on Instagram is, without a doubt, happy, is a city that simply does not exist.
Ancillary Calculations: We found the most emotionally expressive town (regardless of emotion) by averaging all the emotion confidence scores for each city. We found the most poker-faced town (where neutral expressions reign supreme) using the same happiness index methodology, just for neutral expressions. We identified the cities with the most intense smiles by multiplying the number of detected happy expressions by their emotional confidence score, where the highest value corresponds to the most intense happiness (regardless of the number of happy faces).
Emotional Range: To identify towns with the most emotional diversity, we utilized the Shannon Diversity Index across the seven basic emotions that DeepFace detects. That equation = -SUM( p_i * LN(p_i) ).
Fair Use
When using this data and research, please attribute by linking to this study and citing Beach.com.